IoT sensors offer an inexpensive way of monitoring the indoor environment; with battery-powered sensors able to monitor temperature, humidity, CO2, room occupancy and light levels. Due to Covid restrictions, many of you will be working home like me. To demonstrate the effective use of the technology, I installed a single IoT sensor in my home office to highlight the different use cases and value of IoT. I then look at some applications of IoT in healthcare, business and the public sector.
Home office environment
As I will be working from home (for at least 21 days) – I figured it would be interesting to monitor my working environment.
- Does my room have good ventilation, or do CO2 levels rise to the point where I am cognitively impaired?
- Is my room freezing, or am I just imagining it?
Before discussing the IoT sensor and the data it produces, I thought it would be useful to explain my working-from-home environment:
- Small home office (spare room), around 7.5m2.
- Double glazed window.
- Single radiator.
- Desktop PC, two screens.
- Single door – normally closed.
Depending on calls/etc., anywhere from 08:00 – 18:30
It is only me in the room, mostly accompanied by my Boston Terrier. ![]()
Office air quality monitoring
Air quality monitors can be installed throughout an office building to monitor the temperature, humidity, ventilation and light levels. The simple battery powered sensors can be deployed in minutes with measurements taken every 10 minutes. Data, charts and patterns can be visualised using an online dashboard system.
School and college air quality monitoring
CO2 and ventilation can be monitored using IoT for schools, colleges and universities.
Sensors
The sensor I used at home is the Elsys ERS CO2 – which is an indoor, battery-powered sensor that measures the following:
- Carbon dioxide.
- Temperature.
- Humidity.
- Light levels.
- Motion (uses PIR)
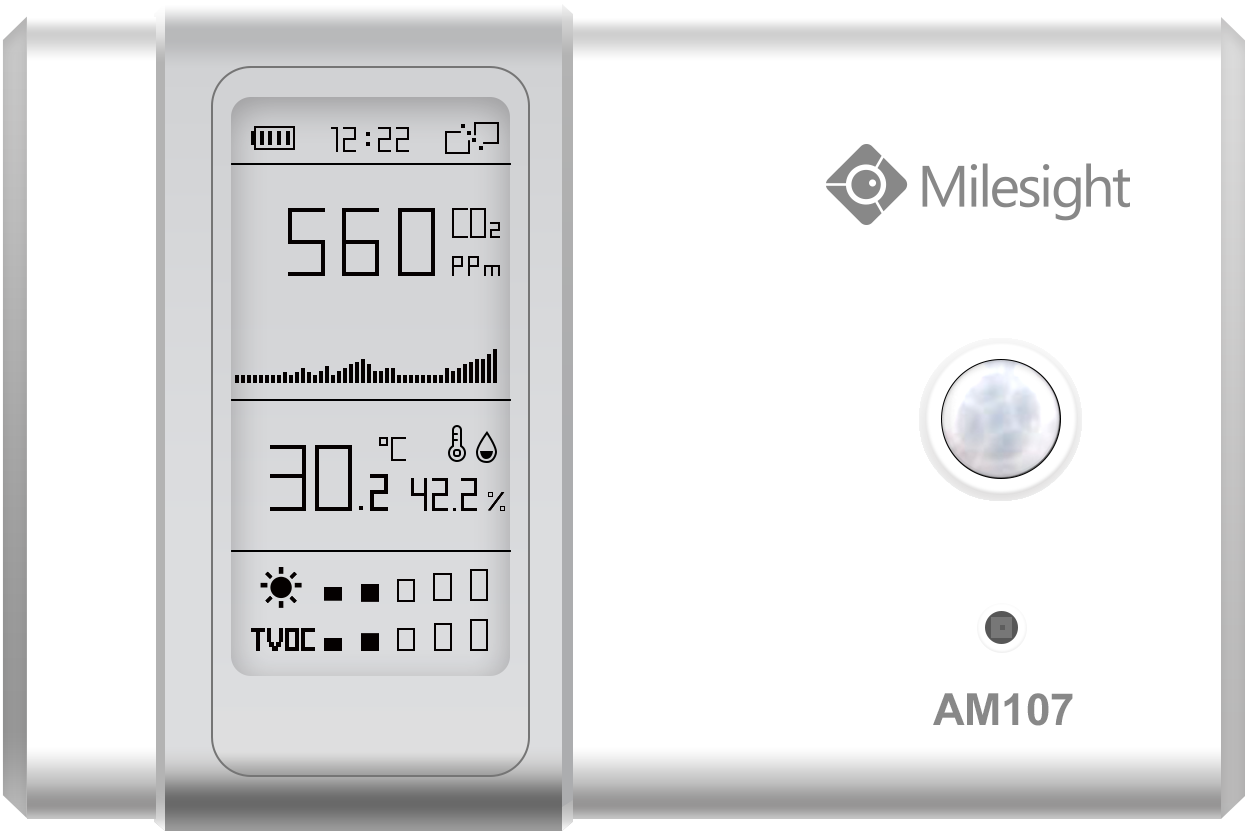
Milesight produces the AM107 which is also a fantastic alternative but includes an e-Ink display, an enhanced CO2 sensor, and the ability to measure TVOC (Total volatile organic compounds). These sensors run on battery and send their data back to the cloud using the Isle of Man LoRaWAN network. The sensor is configured to take measurements every 10 minutes.
(MTG can supply and configure Milesight & Elsys sensors let us know if you are interested).
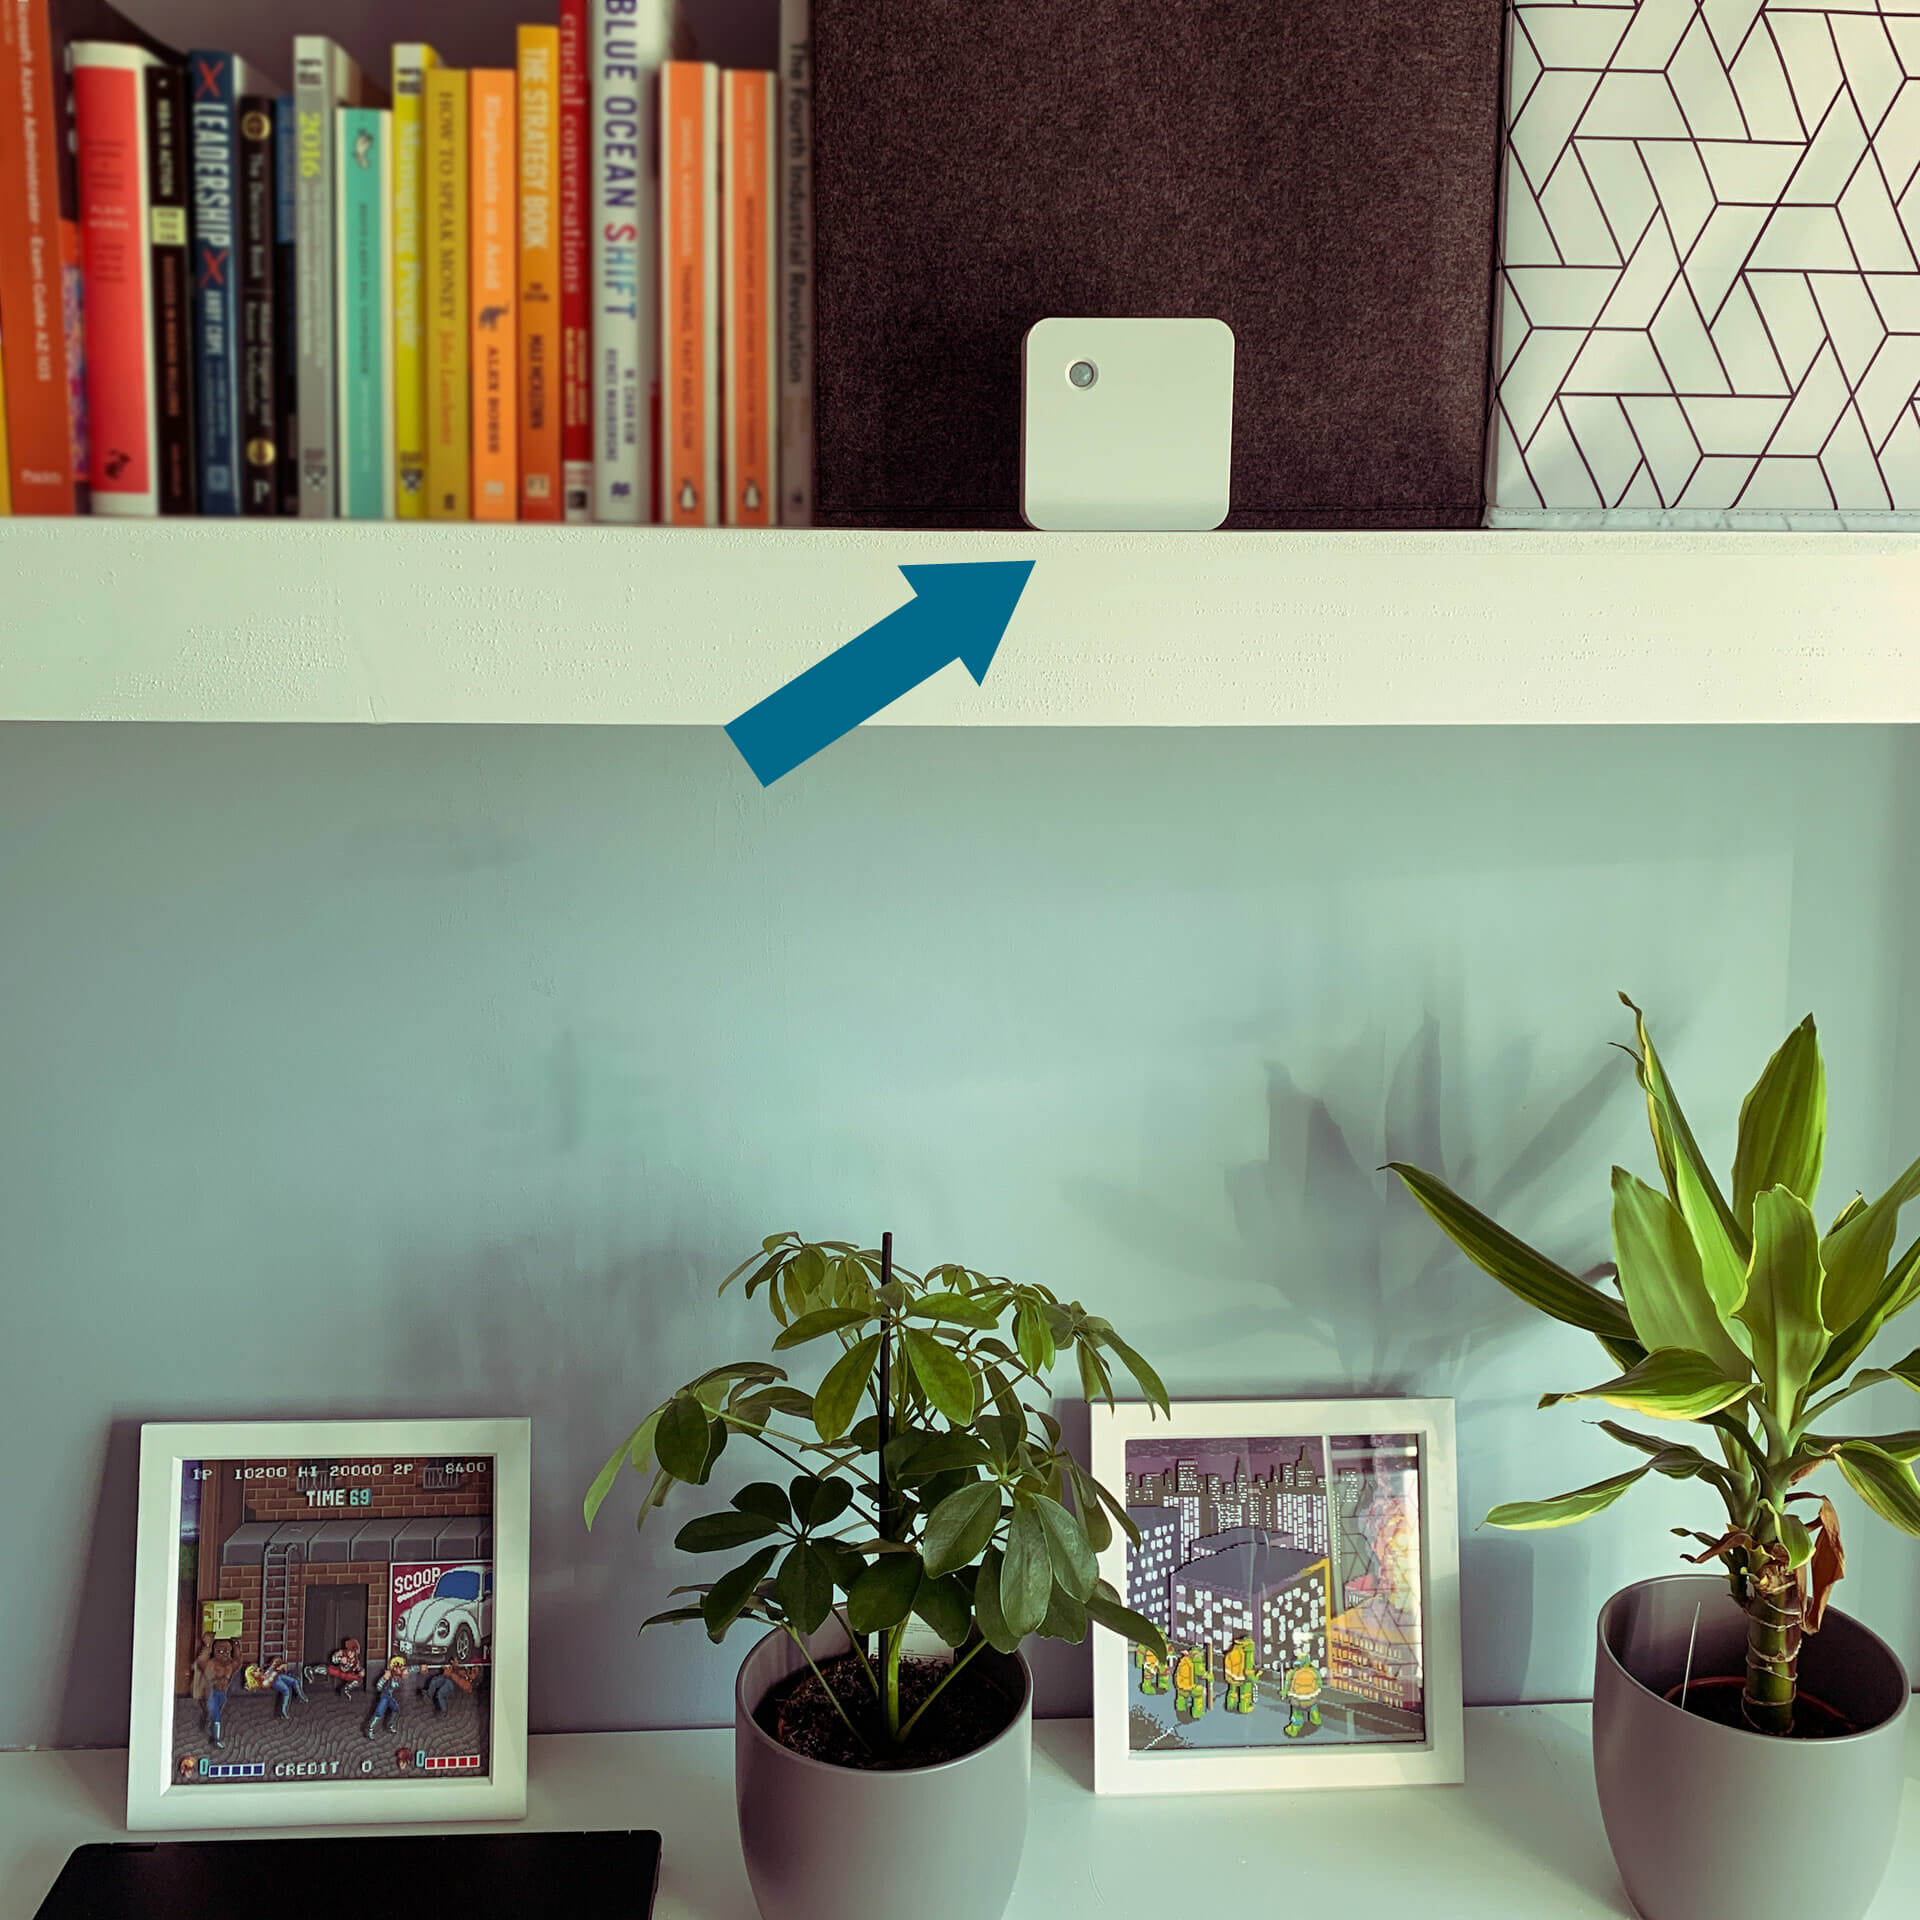
Sensor installation
The term installation is probably an exaggeration; it simply involved placing the sensor on a shelf behind my desk!
LoRaWAN sensors are super low power, so most sensors will happily run from battery (or solar). These sensors do require the use of a LoRaWAN network. We are quite fortunate in the Isle of Man as we have a national LoRaWAN network, much like Scotland.
For commercial deployments where you wish to monitor the indoor environment (i.e. schools, commercial buildings); LoRaWAN gateways are relatively inexpensive (£250 – £1500) and have an extensive range, so it is simple to cover the indoor (500m) and outdoor environment (500m – 15km). Gateways can serve several thousand sensors too! If you wanted to monitor your office environment, you could install your own network as you would do with WiFi.
The Data
I have attached two charts visualising data collected from the home office sensor:
- Chart 1 – shows light levels and movement.
- Chart 2 – shows temperature and humidity.
For simplicity and annotation purposes, I imported the data into Excel. Our commercial IoT solutions would have a real-time dashboard, charts and alerting functionality. (I actually exported the data from our Thingsboard instance).
Chart 1
The chart below has three axes:
- X-Axis – Time (24-hour period from 09:30 to 09:30)
- Y-Axis 1 (Left) – Light levels
- Y-Axis 2 (Right) – ‘Motion’ or occupancy. When I am in the room.

What does Chart 1 show?
The blue area chart shows the light levels in my office. You can see no light in the evening, and light levels increase as the sun rises in the morning. When I’m working in the office, I may also have ambient lighting switched on.
Yellow vertical bars show motion events, i.e. times where I am present and moving. I don’t fall asleep at my desk, so it is fair to assume that I am working in the office when a yellow bar exists.
Several points are highlighted on the chart:
- I had a cup of tea at 10:30 am and another at 11:50 am.
- I was out of the office on lunch from 14:10 onwards for about an hour (note the lack of yellow bars).
- I stopped working and went ‘home’ (downstairs) at around 19:00
- I went back into the office at 23:00 to send an e-mail.
Chart 2
The chart below has three axes:
- X-Axis – Time (24-hour period from 09:30 to 09:30)
- Y-Axis 1 (Left) – Carbon dioxide levels (CO2) in PPM (parts per million).
- Y-Axis 2 (Right) – Is the temperature in degrees celsius.
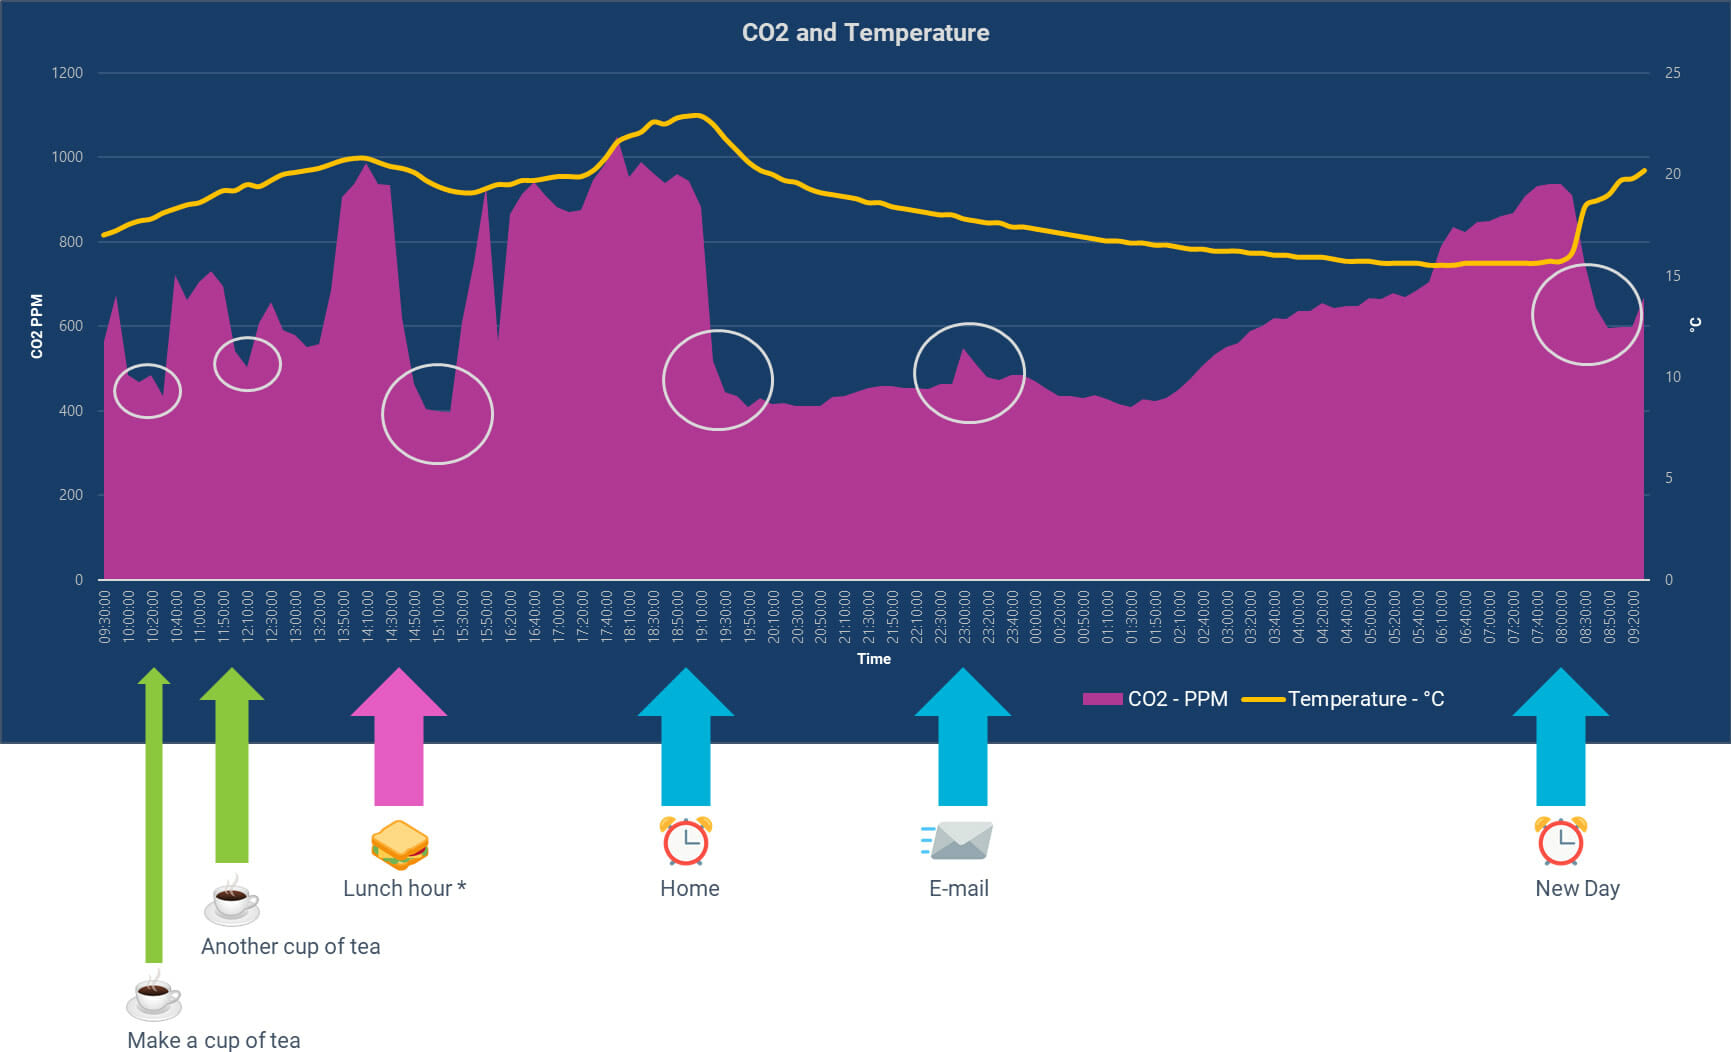
What does Chart 2 show?
The pink area chart shows the CO2 levels in my office. CO2 is measured in PPM where ~450ppm is atmospheric CO2. Studies have shown levels above 1,000 – 2,000 can result in cognitive impairment, feelings of tiredness etc. When you reach that, it’s time to open the window!
Room temperature is reflected by the yellow line; it’s relatively stable (between 15 and 20 degrees C).
I have highlighted a few points in the day:
- You can see a reduction in CO2 when I had tea breaks in the morning, and a lunch hour later in the afternoon.
- I think the higher levels (or spikes) of CO2 at 10:30 and 16:30 were during conference calls (when I probably spoke too much).
- My snoring dog accompanied me in the afternoon – so CO2 was probably collectively higher because of this.
Importance of the indoor environment
Indoor air quality and working conditions have long been a topic of discussion and research.
Optimal temperature and humidity levels, the link between CO2 and cognitive performance, and the right light levels are considerations for architects, landlords, employees and employers alike. (I discussed the concept in another blog post, see Sick Building Syndrome).
While the data does not really impact my home-working (besides opening the window or having lunch earlier) – it has some exciting applications in business, the community, and the public sector.
Applications
I have highlighted many of the potential applications of the technology below. IoT sensors monitor the indoor environment and are used for activity monitoring and a range of other, novel applications.
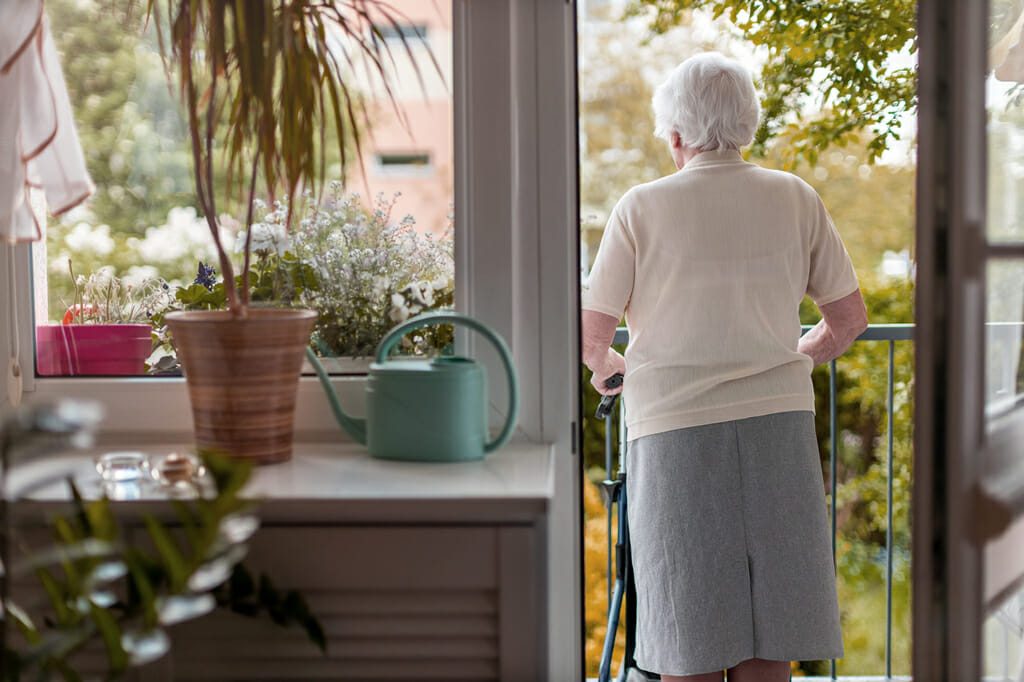
Independent living
The same sensors can monitor vulnerable relatives, elderly family members, or those living alone. Motion sensors serve as activity monitors. Alerts can be generated if the movement is not detected. Relatives can be sent a WhatsApp or SMS. Sensors can be installed with ease, and the monitoring system can ensure privacy, security, etc.
Social housing
Many councils face issues with reports of damp or similar challenges arising from their housing stock. Indoor IoT sensors can monitor humidity levels and pro-actively notify the council that damp is detected (poor ventilation, tumble dryers, etc.).
Vacant property monitoring
The PIR, motion and CO2 sensors can be installed in the vacant property to detect unauthorised access. Running for years on battery and with an extensive range makes for a compelling alternative to security alarms.
Sheltered housing
With local authorities under budgetary pressures, IoT sensors can be deployed throughout sheltered housing to support the warden’s work.
Schools and Colleges
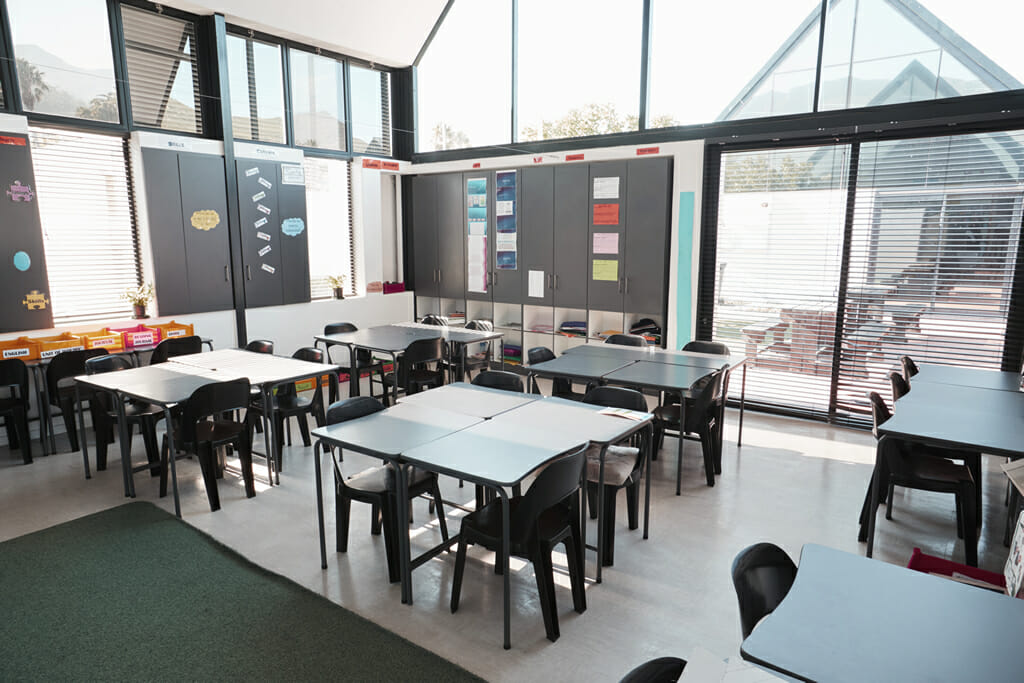
Given the importance of air quality and CO2 levels on cognitive performance and concentration; sensors can be deployed to ensure students and teachers’ have optimal air quality. Perhaps poor concentration and focus are due to CO2, not the students (or teacher).
Landlords and building/estate managers
What is the current utilisation of the meeting rooms, offices, classrooms? What is the utilisation over a calendar month? IoT sensors can monitor rooms’ occupancy, and this data can be used to aid decision making.
Hospitals
Treatment rooms, consultation rooms, and private room utilisation can be monitored in real-time with ease.
Retro-fit BMS
Some buildings have legacy or dated BMS systems. Deploying LoRaWAN and IoT is a fast-track, relatively inexpensive way of gaining BMS-type functionality without the cost.
Find out more
In this article, I only scraped the surface of what’s possible. Hopefully, it has provided some inspiration for you to consider if you or your organisation has a use for IoT technology? Perhaps you have different ideas for how these sensors can be used?
If you would like to learn more about IoT and the possibilities of the technology, e-mail sales@mtg.im, call +44 1624 777837 or click Request a Quote.