Indoor air quality can be monitored using IoT sensors, so the data is available to view using an online dashboard. Temperature, humidity, CO2 and light levels can all be monitored using smart sensors that are inexpensive, easy to deploy and deliver rich insights to both staff, tenants and landlords.
Data is at the core foundation of the Internet of Things (IoT). IoT has enabled us to capture massive amounts of data that was previously unimaginable. As the adoption of IoT continues to grow, the data is only going to grow with it. The true power of IoT is realised when the data is transformed into intelligence, insights, allowing for patterns and trends to be identified.
A picture tells a thousand words
The big challenge right now in IoT is how to understand and digest large amounts of data effectively. Within the IoT space, dashboards are the central element in bridging this gap, opening the data up to everyone. We have all heard of the cliché “A picture tells a thousand words”, but it’s true, the human brain can remember and interoperate pictures far more simply than words, or in this case, a dashboard over millions of rows of data.
Find out what data you can start collecting with IoT.
Data visualisation
Data visualisations are a must-have in IoT because of the scale of the data that is involved. By visualising just a small summary of detailed data, those trends and patterns become very apparent, easily communicated, and digested without necessarily understanding the data. Not only do data visualisations make understanding data easy, but they are also engaging.
IoT dashboards
A data dashboard within the IoT space organises and presents the data, simplifying what can be quite complex sets of data into easily digestible graphs.
Core advantages of leveraging a dashboard:
-
- Real-time data analysis.
- Breaks the data down.
- Accessible from any device at any time.
- Automatically updated with the latest data.
- Everyone interprets graphs in the same way.
- Can quickly identify correlations and relationships.
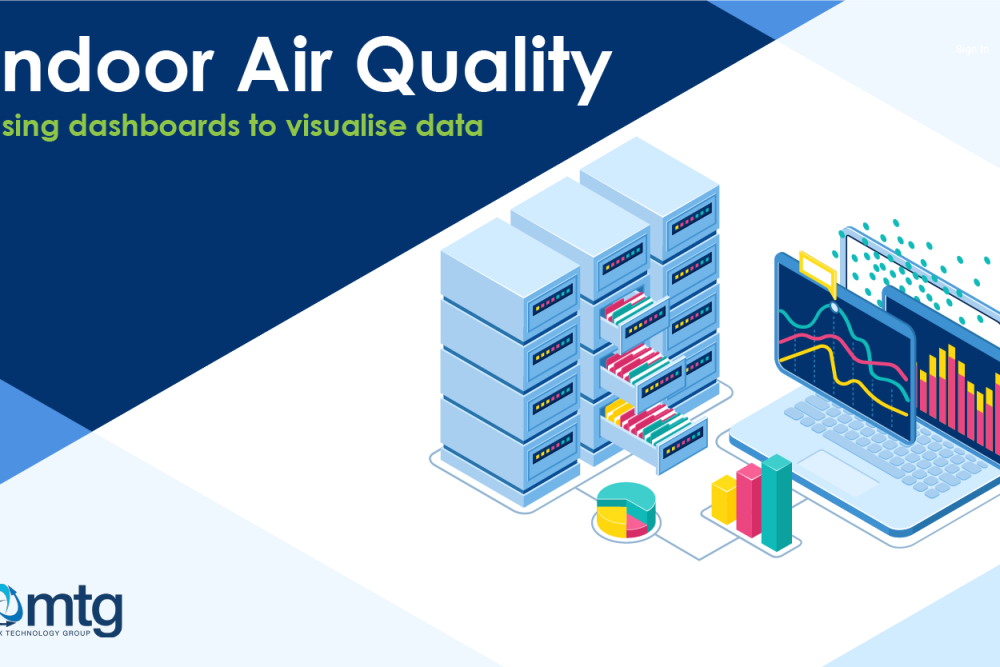
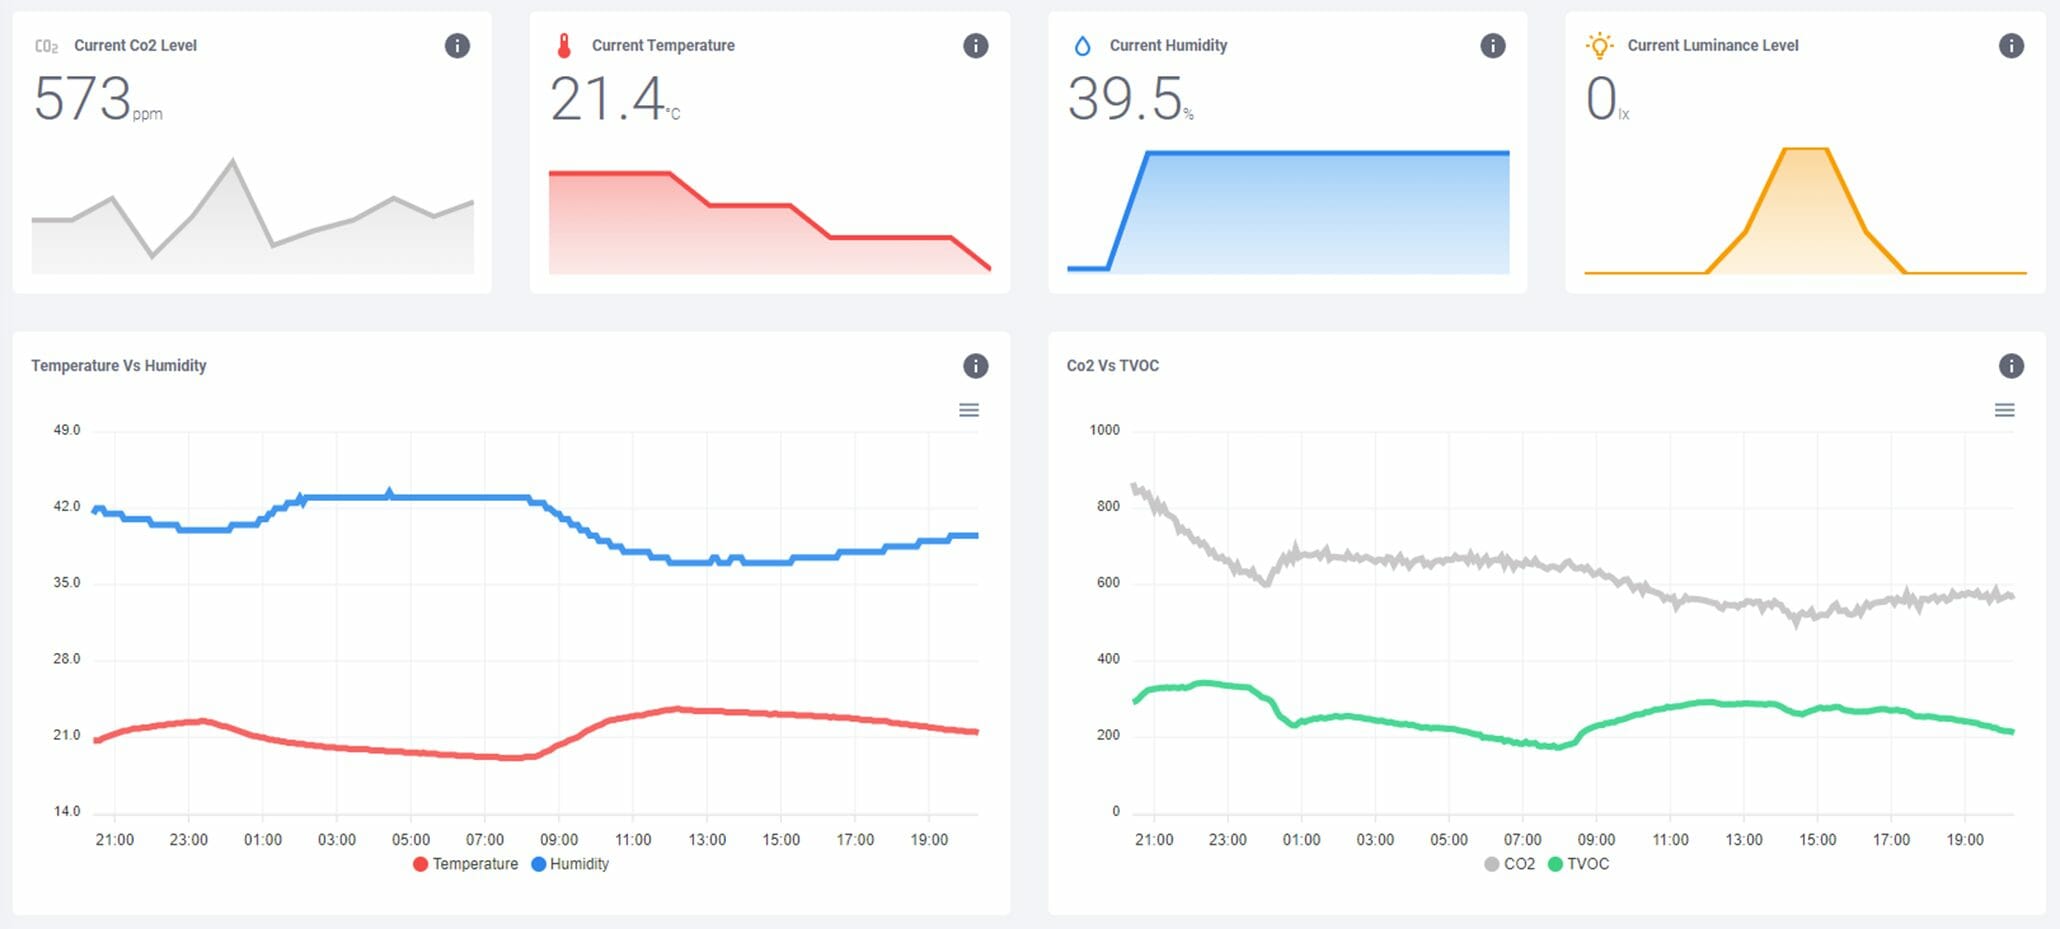
Indoor Air Quality Dashboard
Indoor air quality is more relevant than it has ever been. With people working from home their bedrooms, kitchens and sheds are becoming their working environment. These environments don’t have the same benefits as the open plan air-conditioned offices people are used to. WHO outlines the key elements of indoor air quality here.
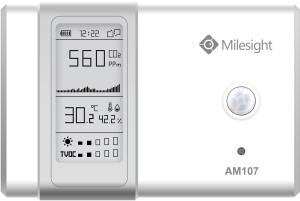
To illustrate a dashboard’s power, we set up indoor air quality monitoring using a Milesight indoor environment sensor and hooked it up to an IoT platform (more on the IoT platform coming soon). This single IoT device captures an impressive amount of environmental variables and reports them back every 5 minutes. The dashboard visualises the captured data from the Milesight sensor.
The indoor air quality dashboard (pictured below) communicates different data sets at different levels. The first level displays simple data points — the current real-time measurements of key environmental variables and the previous 1hrs worth visualised in an area chart.
The second layer of visualisations is line charts, fed with larger data sets of measurements collected over the previous 24hrs. This layer allows you to easily visualise any trends and correlations in the data, thanks to the larger data sets.
From that simple indoor air quality dashboard example, you can start to understand how visualisations play a big part in IoT. The ability to interpret data quickly and effectively allows you to build up strong evidence, driving decisions to impact the environment positively.
IoT Dashboards for different applications
Dashboards can be implemented into any IoT solution, smart environment, smart water, smart agriculture, and many more.
- View soil moisture and weather data with Smart Agriculture solutions.
- Assess river quality with smart water dashboards, including dissolved oxygen, pH, ORP and many more.
- Build a Digital Twin of air quality data in a city, monitoring NOx and particulates.
If you are not monitoring the environment, you can not improve it.
Find out more
Manx Technology Group can design, build, and maintain IoT dashboards for public and private sector organisations. If you would like to learn more about IoT dashboards and how they can benefit your IoT solution, please contact our sales team by e-mailing sales@mtg.im or call +44 1624 777837.
[sc name=”blogfooter” ]