
Network testing is paramount in ensuring your LoRaWAN network succeeds in providing the best signal coverage and quality for your end devices. Like with all wireless devices, LoRaWAN devices need to be installed at a location within the range of the LoRaWAN gateway, but that doesn’t always guarantee a quality signal.
LoRaWAN networks enable a whole range of IoT technologies including Smart Water, Smart Agriculture, Smart Parking, and Air Quality Monitoring, to name a few. Network coverage shouldn’t only cover outside; you may have indoor air quality sensors or similar devices that are situated inside offices.
There are a few factors that determine how good the signal is:
- RSSI – Received Signal Strength Indication. RSSI can be used to measure how well a LoRaWAN gateway can hear an end device.
- SNR – Signal-to-Noise Ratio. SNR determines the level of interference between the LoRaWAN gateway and the end device.
- SF – Spreading factor. SF is the crucial variable, making or breaking your IoT deployment. It determines the data rate between the LoRaWAN gateway and the end device. Often overlooked, the SF also determines the power consumption of the end device.
Now you are probably wondering how to test signal quality out in the field? It is time-consuming and expensive to go deploying and installing the end device in different locations. That is where LoRaWAN field testers come into play, like the Adeunis LoRaWAN Field Tester.
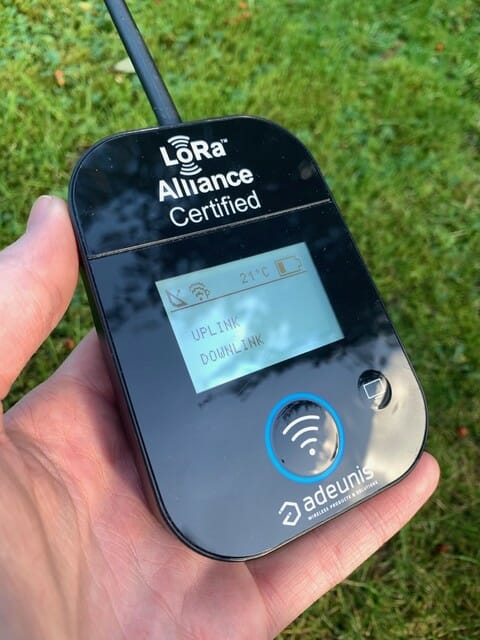
Adeunis LoRaWAN Field Tester
The Adeunis LoRaWAN Field Tester is a handheld device that sends and receives data from the LoRaWAN gateway. Field testers receive RSSI, SNR, and SF data on an uplink to the gateway (sending data) and again on a downlink received from the gateway (receiving data). Having a handheld device is a massive advantage because you can test different deployment locations and see the signal quality in real-time on the built-in display. Seeing data on the device display is useful, but only for the person using the device at that time. Capturing and visualizing the data makes it available to whoever needs it whenever they need it.
Collecting and Visualising data on a map
In a few easy steps, you can put together data collected from the Field Tester and start to visualize it on a map. We have built a simple pipeline from Field Tester to data map using Azure, a database, and Zoho Analytics.
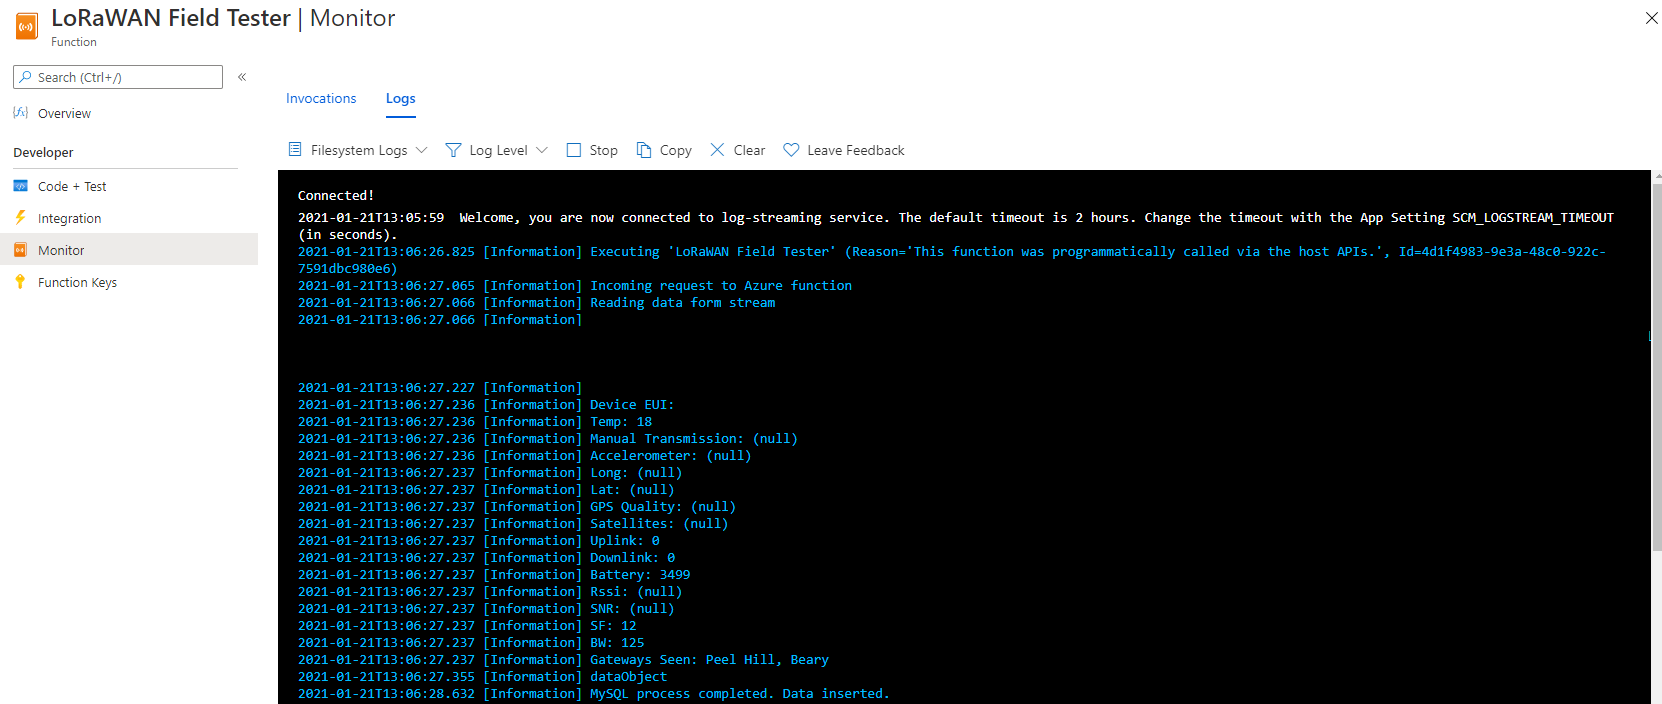
The decoder
You might think a decoder sounds complicated, but it is not. You only need an Azure account and an understanding of code to get started. The decoder is an Azure Function that is a serverless piece of code and has an endpoint URL. An Azure Function is triggered whenever it receives data, in this case, a field tester uplink. That’s all there is to a decoder. It will sit there waiting for an uplink, decode it, and then insert it into a database.
LoRaWAN Network Server Data Push
All LoRaWAN Network Servers (LNS) has a data push capability allowing you to push data received by a LoRaWAN gateway to a specific endpoint URL, in this case, the decoder. With the decoder set up and waiting to get put to work, update the data push on the LNS with the decoder endpoint URL from Azure, and that’s it. The LNS will start to send the data received from the field tester to the decoder for decoding.
Visualizing the data on a map
Zoho Analytics is a powerful tool to visualize data on a map. Out of the box, Zoho Analytics has geolocation features that allow you to plot data on a map based on longitude and latitude coordinates. Hook your database up to Zoho Analytics and configure how often to query for new data from the database, ensuring the map has the most recent data from the field tester. We tested the network signal strength to the various Kerlink LoRaWAN gateways deployed throughout the Isle of Man as part of the national network.
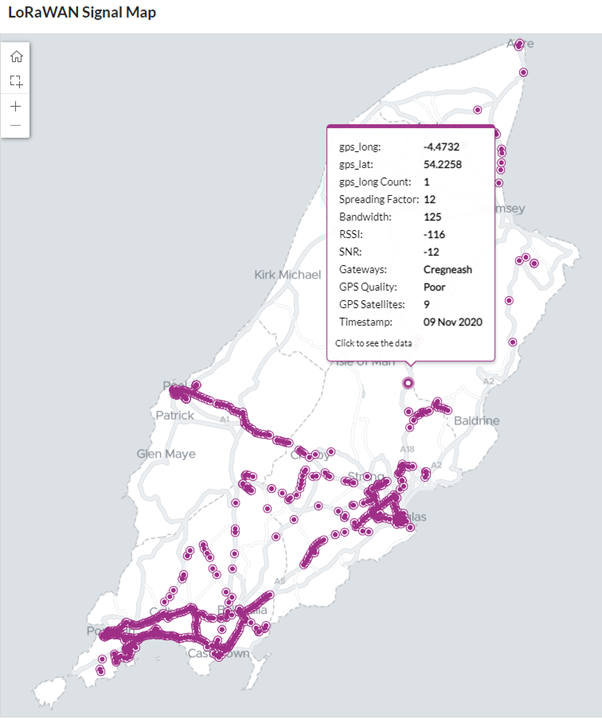
You might be thinking, how can I put all this together in a real-world application? Well, we put an Adeunis LoRaWAN Field Tester in our work vans, including our IoT van, then set it to automatically test the LoRaWAN signal every 10 minutes, resulting in 1000’s data points collected from van journeys. 1000’s rows in a database would be tedious to scroll through and ingest the data, but with a map visual, it was more engaging and provided a better insight.
Find out more
Manx Technology Group can design, build, commission, and maintain LoRaWAN networks on behalf of public and private sector organisations. If you would like to learn more about IoT or LoRaWAN’s benefits, please contact our sales team by e-mailing sales@mtg.im or call +44 1624 777837.