Indoor air quality can be monitored using IoT sensors, so the data is available to view using an online dashboard. Temperature, humidity, CO2 and light levels can all be monitored using smart sensors that are inexpensive, easy to deploy and deliver rich insights to both staff, tenants and landlords.
Sick Building Syndrome and IoT
Sick Building Syndrome describes a situation where the occupants of an office or building suffer from nonspecific health issues or feel under the weather when spending time in the building. Internet of Things (IoT) technologies can monitor several parameters that may contribute to sick building syndrome, including pollutants, legionella, VOC (volatile organic compounds), temperature, moisture, CO2, light and noise levels. Read more
Soil Monitoring with IoT – Smart Agriculture
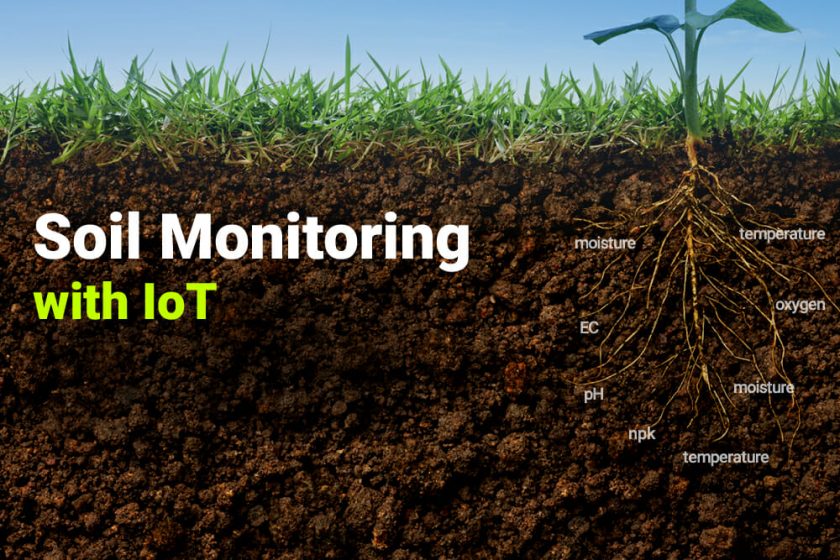
Soil Monitoring with IoT uses technology to empower farmers and producers to maximise yield, reduce disease and optimise resources. IoT sensors can measure soil temperature, NPK, volumetric water content, photosynthetic radiation, soil water potential and soil oxygen levels. Data from the IoT sensors are then transmitted back to a central point (or the cloud) for analysis, visualisation and trend analysis.
The resultant data can then be used to optimise farming operations, identify trends and make subtle adjustments to conditions to maximise crop yield and quality. The use of IoT in agriculture is known as Smart Agriculture (or Smart Farming), and IoT is a central component of Precision Farming. Read more
Case Study: LJMU – Air Quality and Weather Monitoring with IoT
Manx Technology Group supplies Air Quality Monitoring and IoT technology to Liverpool John Moores University for use as part of the LCR Sustainable Green Travel Corridors Project (also called LCR SUD). LCR SUD is a £16.7m project until 2021 and part of a Liverpool City Region-wide initiative to encourage more cycling and walking. Read more
Using IoT to monitor air quality near schools
A recent report from campaign group Mums for Lungs and environmental charity Possible has highlighted the impact of air pollution on children. Pollution intensifies around schools at drop-off times, with NO2 levels up to 5x higher than usual. IoT sensors can help education leaders, schools and councils measure air quality, particulates and NO2 levels. The data from these sensors can then be used to educate, inform and accelerate positive change. Read more
LoRaWAN network testing for IoT with Adeunis, Azure & Zoho Analytics
Network testing is paramount in ensuring your LoRaWAN network succeeds in providing the best signal coverage and quality for your end devices. Like with all wireless devices, LoRaWAN devices need to be installed at a location within the range of the LoRaWAN gateway, but that doesn’t always guarantee a quality signal. Read more
Measuring bathing water quality with IoT
Monitoring bathing water quality with IoT reduces cost, improves coverage and provides real-time measurements. The use of IoT technology offers rich datasets and real-time alerting for bathing water or pollution events.
Internet of Things – Low Power WAN Technologies
An LPWan (Low Power Wide Area Network) is a type of wireless network , well suited for IoT and sensors, where low-power, long-range data communications is a requirement. Typically LPWan technologies have data-rates of less than 100Kbps so are not comparable to broadband, but are well suited to data transmission from IoT sensors. Read more
IoT particulate sensor accuracy – How accurate are they?
How do IoT air particulate sensors compare to the reference-grade equipment used by agencies and Government bodies? In this post, we look at the level of accuracy that can be achieved using the Libelium Smart Environment compared to more expensive reference equipment.
Monitoring water quality with IoT and Microsoft Azure
Microsoft Azure is a powerful platform on which you can build your IoT application. We look at how Libelium IoT sensors, Azure IoT Hub and PowerBI can be used to monitor air quality in several easy steps. Data such as pH, ORP and temperature are collected, transmitted using 4G then processed and visualised using Microsoft Azure, Azure SQL and PowerBI. Read more